
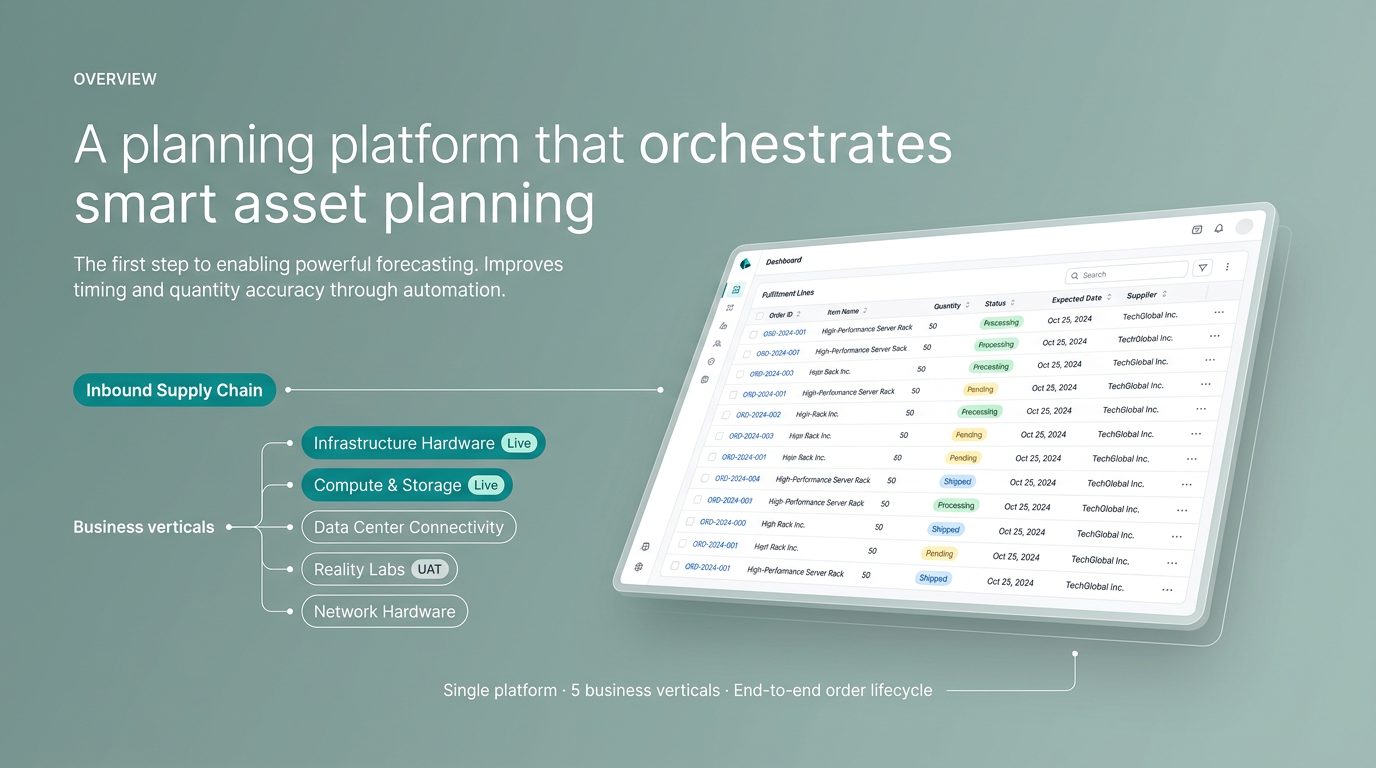
Overview
The company's AI infrastructure investment — $600B+ in data centers, networking, and compute — runs on a supply chain that, until 2022, was managed across 13+ disconnected tools: spreadsheets, email threads, legacy ERPs, and custom one-off dashboards. No single source of truth. No unified workflow. No visibility across the lifecycle of an order.
I was brought in as the lead designer to build the platform from zero — owning the full design scope from discovery through GA launch, across the order lifecycle from procurement to delivery.
The problem was not a missing feature. It was a missing system.
The supply chain organization had grown faster than its tooling. Each team had built local solutions to local problems — which meant that a single order might touch 5 different systems before it was fulfilled. No one had a complete picture. Errors were caught late. Escalations were manual. The cost of coordination was enormous.
13+ disconnected tools
Procurement, logistics, vendor management, and delivery tracking each lived in separate systems with no shared data model.
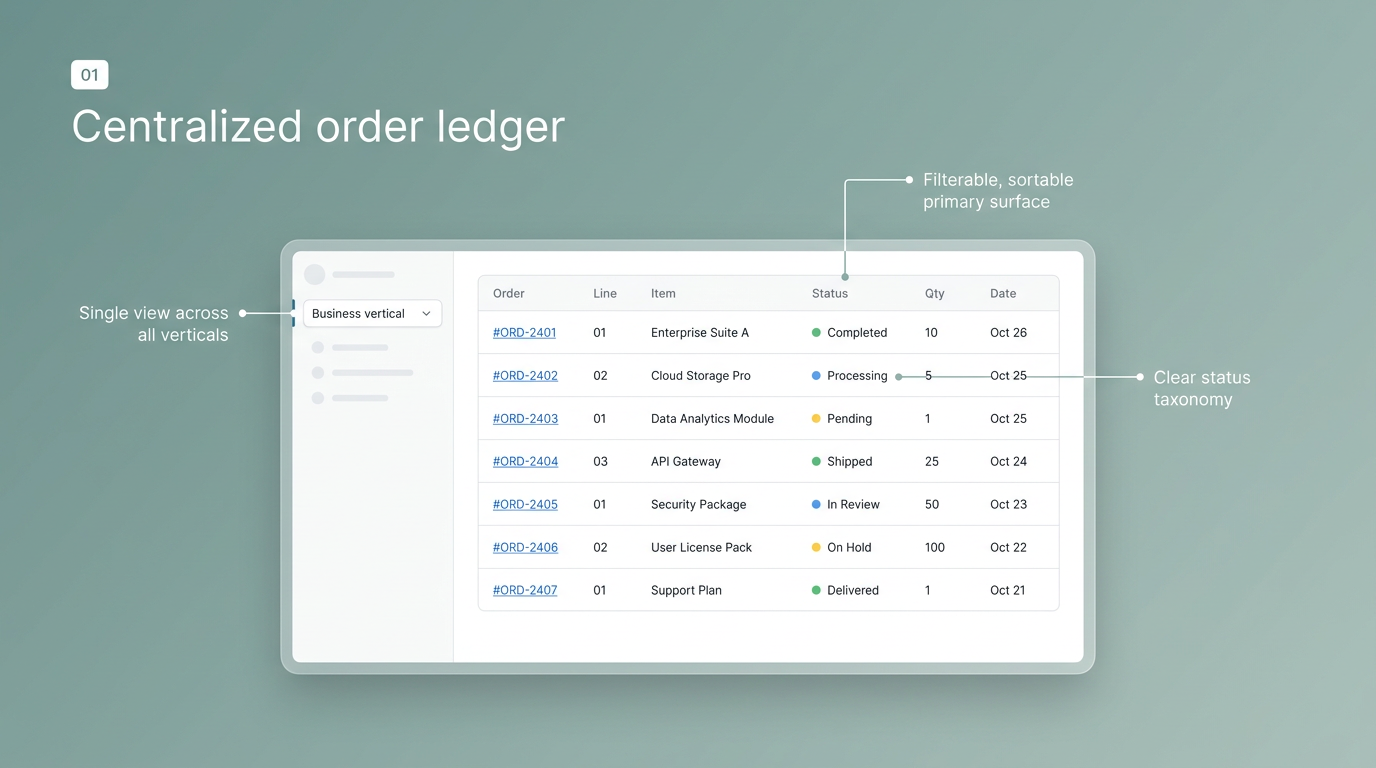
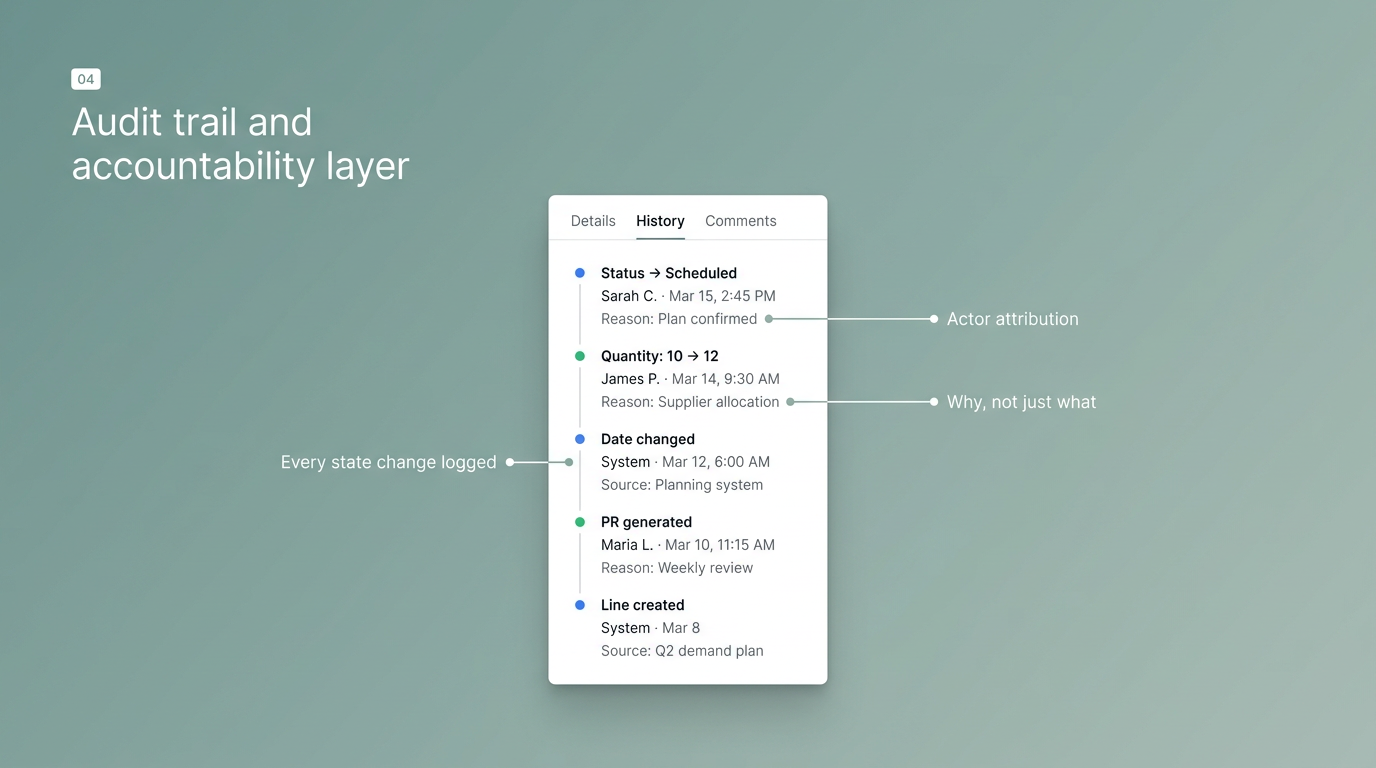
No unified order state
There was no single place to see where an order was in its lifecycle — from PO creation through delivery confirmation.
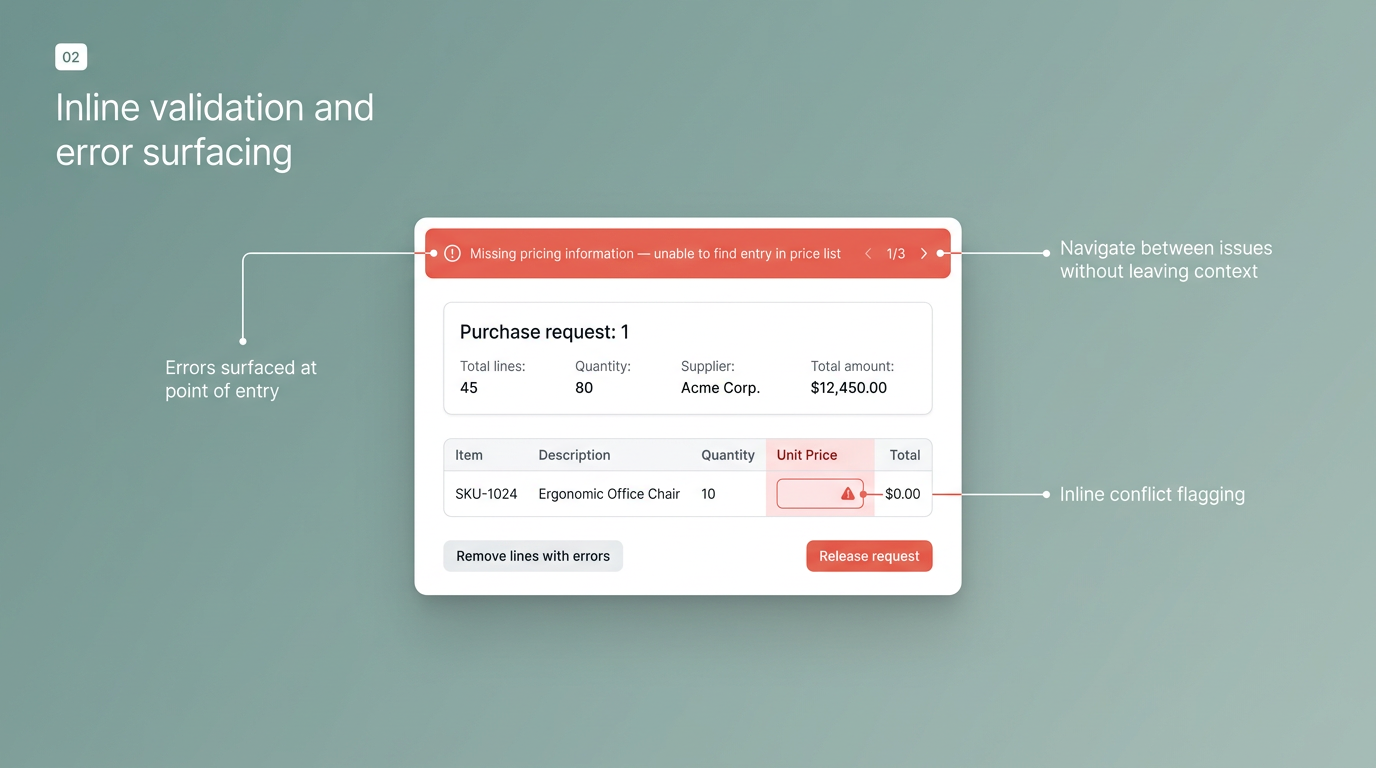
Manual escalation paths
When orders were delayed or blocked, the resolution path was email. There was no structured workflow for exception handling.

Approach
Three phases, built sequentially.
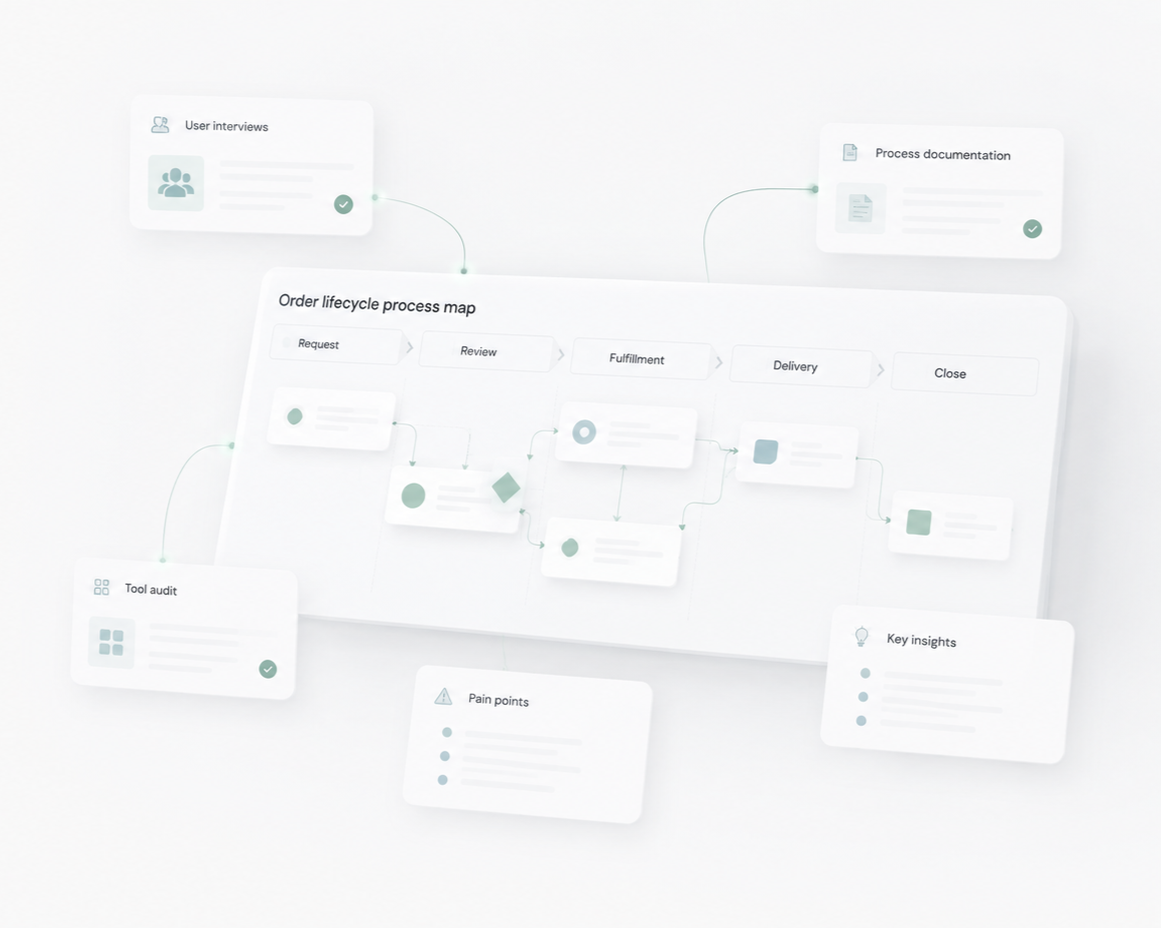
Discovery — mapping the existing system.
Spent the first 6 weeks embedded with the supply chain operations team, shadowing order managers, conducting structured interviews, and mapping the full order lifecycle across all 13 tools.
Output: a unified process map that became the shared reference for the entire product team.

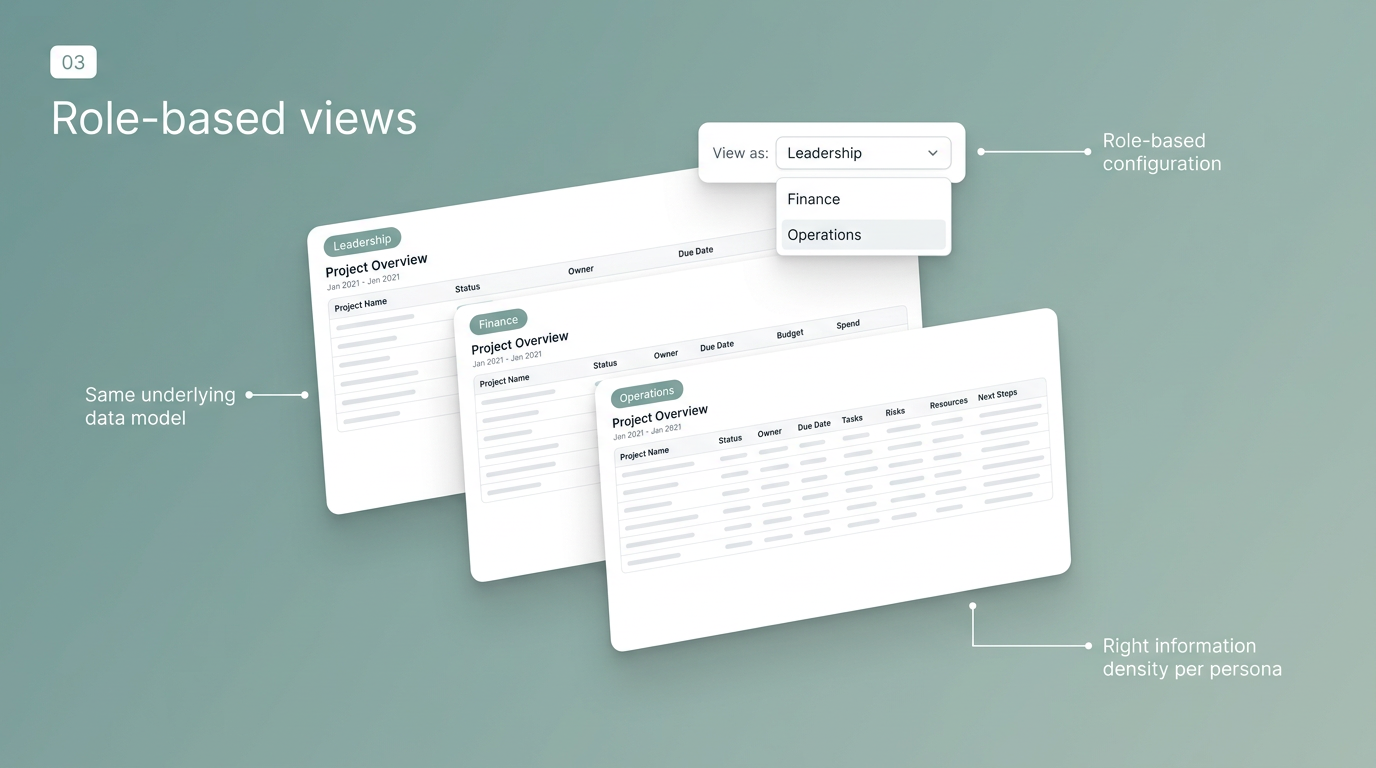
Architecture — designing the data model before the UI.
Before opening Figma, I worked with engineering to define the core data model: what is an order, what states can it be in, what events trigger state transitions, and what roles need what visibility.
The information architecture was designed to reflect the actual lifecycle — not the org chart.
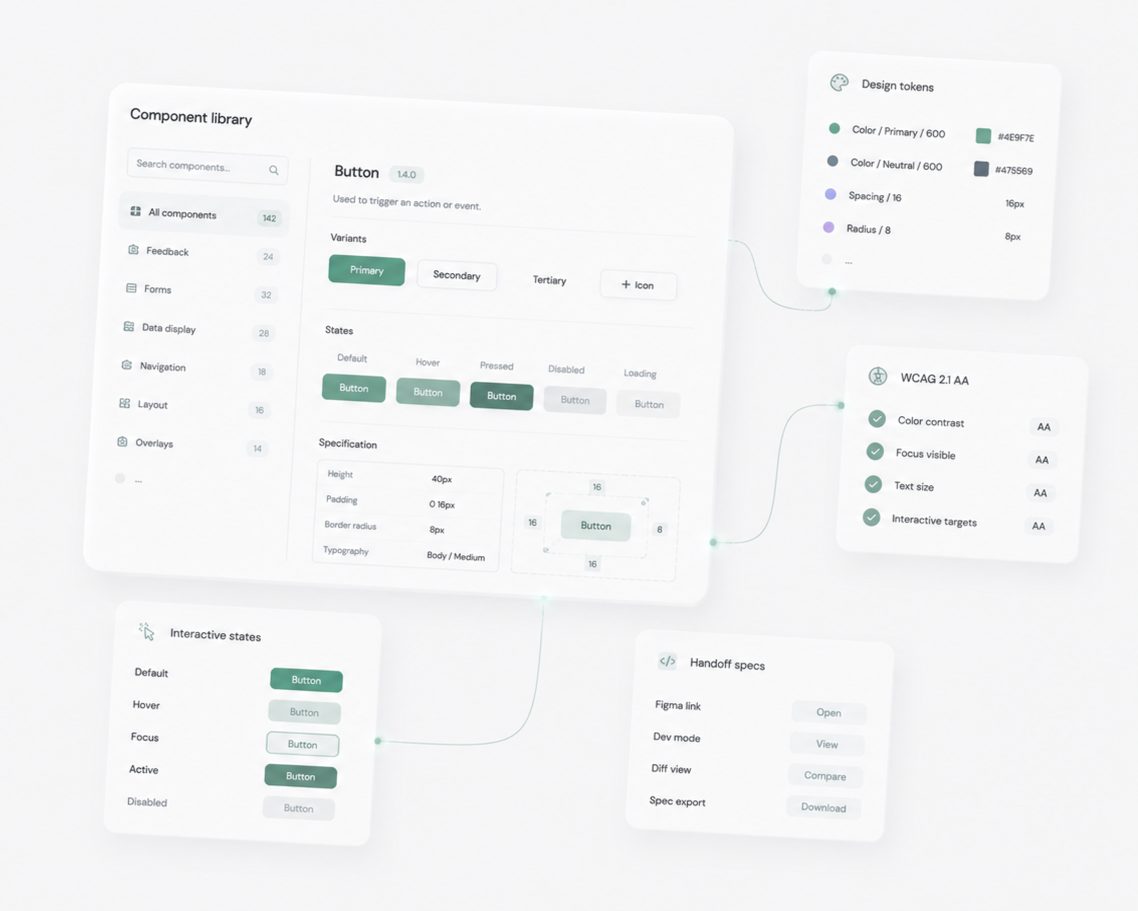
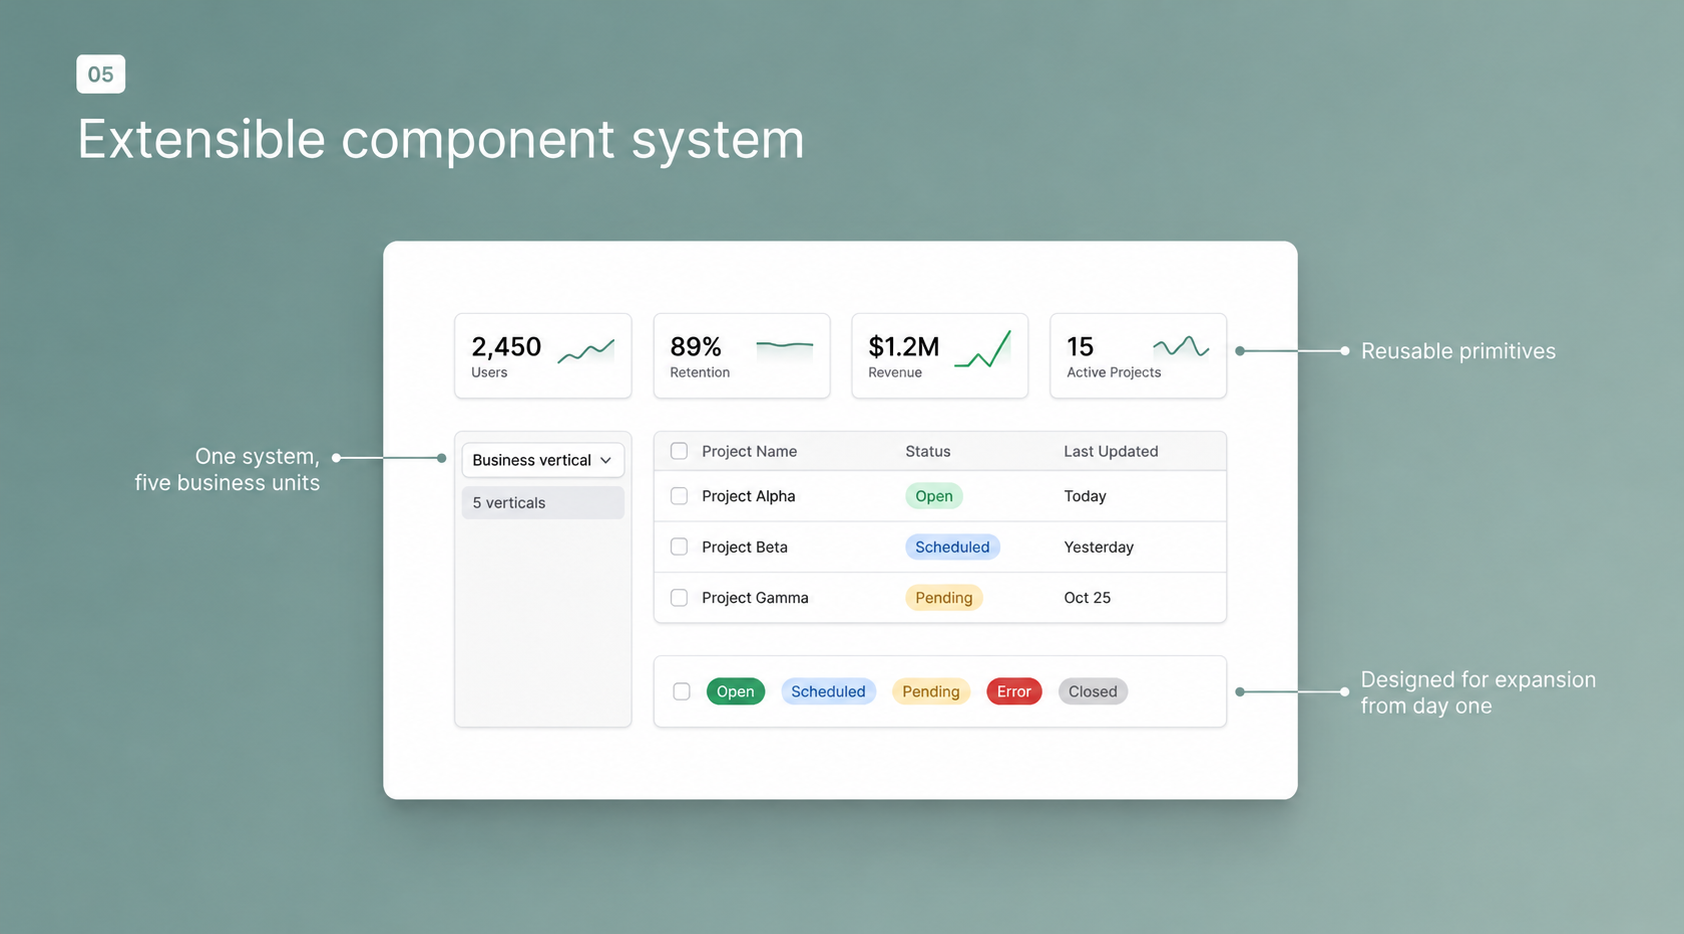
Execution — component-driven, handoff-ready.
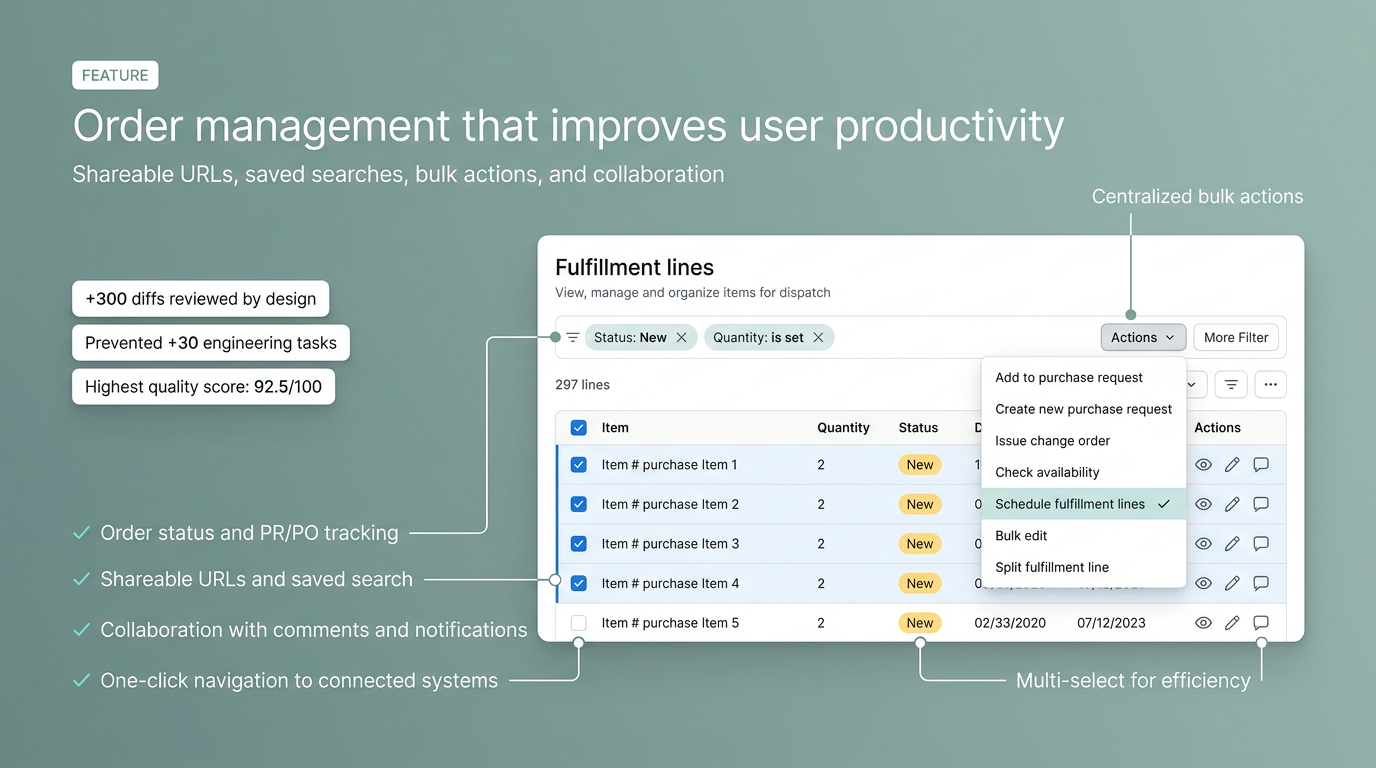
All UI work shipped with a documented component library: token definitions, variant specs, interactive states, and annotations.
Handoff included diff-ready specs — not static exports — so design QA was built into the engineering review process.
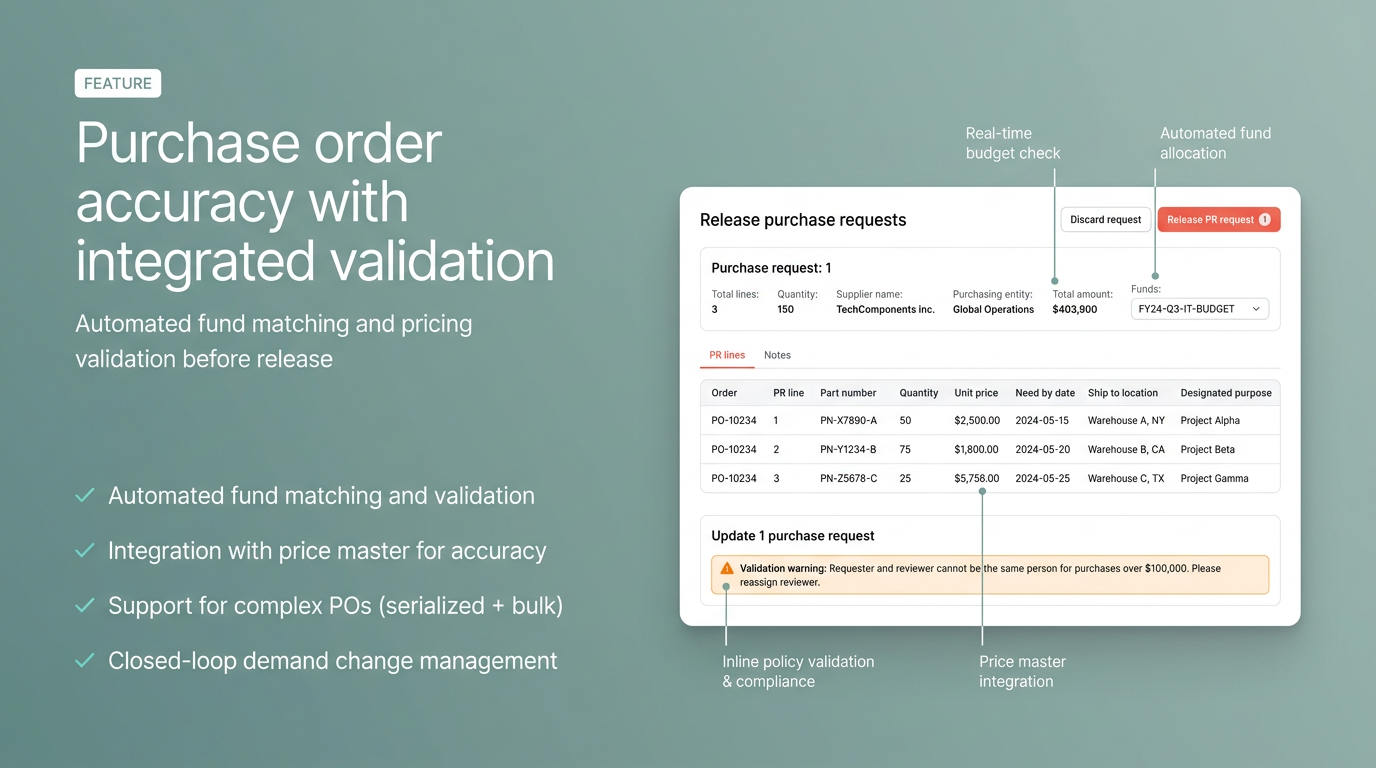
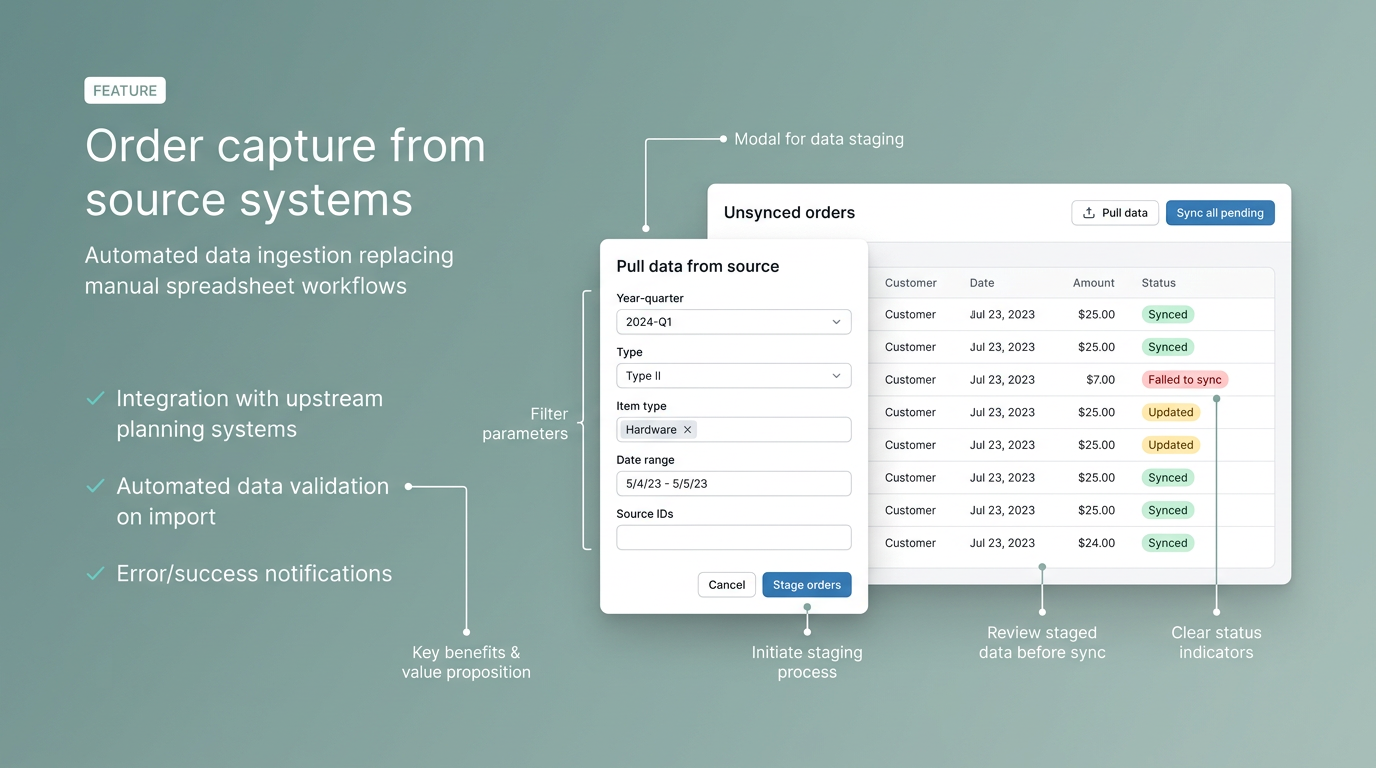
Key Design Decisions
Three decisions that shaped the platform.
OUTCOMES
The platform shipped to 100% adoption within the supply chain organization — which, given the number of legacy tools it replaced, required a change management strategy as much as a design strategy. The adoption rate is a function of the platform being genuinely better than the alternatives, not just mandated.